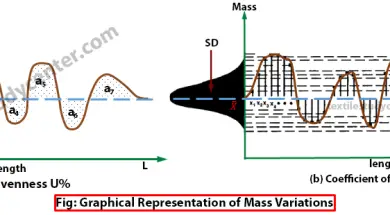
Graphical Representation of Mass Variations
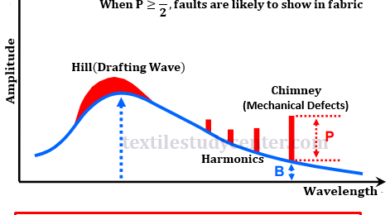
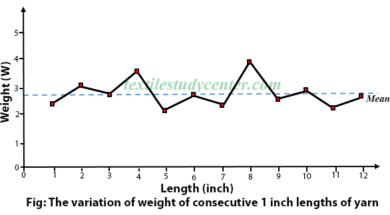
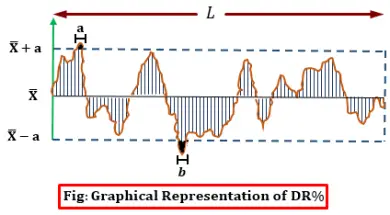
0shares Facebook Twitter LinkedIn Tumblr Digg Print Reddit Weibo Xing Blogger MySpace Graphical Representation of Mass Variations Graphical representations are aimed at providing easy analysis possibilities as well as providing more complete information than the numerical estimates. The following graphical representations are common with the latest generation evenness testers. Spectrogram 3D Spectrogram Variance Length Curve […]
