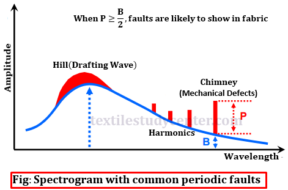
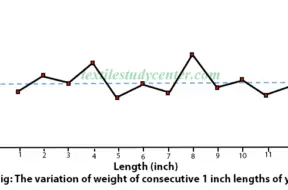
0shares Facebook Twitter LinkedIn Tumblr Digg Print Reddit Weibo Xing Blogger MySpace Graphical Representation of Mass Variations Graphical representations are aimed at providing easy analysis possibilities as well as providing more complete information than the numerical estimates. The following graphical representations are common with the latest generation evenness testers. Spectrogram 3D Spectrogram Variance Length Curve […]
Yarn Testing
Yarn Evenness II It’s Classification
0shares Facebook Twitter LinkedIn Tumblr Digg Print Reddit Weibo Xing Blogger MySpace Yarn Evenness & It’s Classification Evenness, Unevenness, regularity, and irregularity are common terms used to describe the degree of uniformity of a textile product. In the textile field, the uniformity of products like the lap, sliver, roving or yam is expressed in terms […]
Methods of Evenness Testing
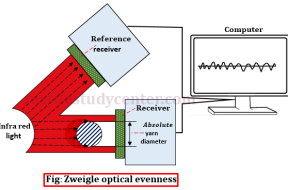
The optical method measures the variations in diameter of a yarn and not in its mass. The instrument an infra-red transmitter and two identical receivers. The yarn passes at speed through one of the beams, blocking a portion of the light to the measuring receiver. The intensity of this beam is compared with that measured by the reference receiver and from the difference in intensities a measure of yarn diameter is obtained.